

Executive Summary
In a market where trial drives growth, store-level sampling can no longer rely on intuition, historical averages, or distributor anecdotes. A store-level sampling forecast model enables beverage leaders to predict performance before activation—aligning field execution, inventory, and retailer expectations with measurable outcomes. This article outlines a practical, scalable approach to building a forecast model that improves ROI, strengthens distributor alignment, and professionalizes sampling as a revenue engine.
Why Store-Level Forecasting Has Become a Commercial Requirement
Sampling remains one of the highest-impact activation tools in beverage. However, most organizations still plan events using broad assumptions:
- “High-traffic store”
- “Strong account”
- “Good demographic fit”
- “Successful in other markets”
Those inputs are useful—but insufficient.
Industry estimate: experiential and in-store sampling programs account for 15–25% of trial acquisition spend for many emerging and mid-sized beverage brands, yet fewer than 30% of programs apply store-specific forecasting or performance modeling (estimate based on agency and distributor program audits).
As budgets tighten and distributor teams demand predictability, sampling must be forecasted with the same rigor applied to promotions, pricing, and distribution.
What Is a Store-Level Sampling Forecast Model?
A store-level sampling forecast model predicts expected commercial impact from a single activation at a specific account.
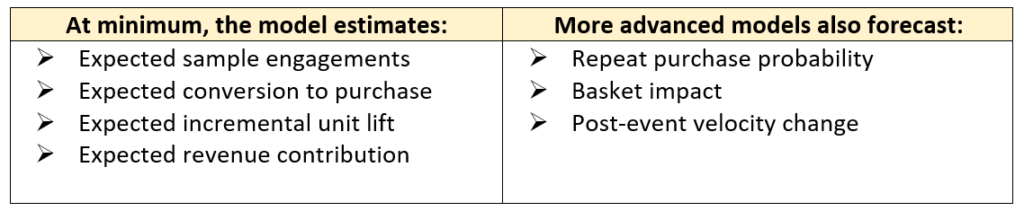
The objective is not perfect precision. The objective is decision-grade confidence.
Core Inputs Required to Build a Practical Model
1. Store Characteristics
Foundational attributes should be normalized across all accounts:
- Store format (independent, regional chain, national chain, on-premise retail)
- Average weekly traffic (if available)
- Store size and assortment depth
- Category adjacency (how crowded the set is)
If traffic counts are unavailable, proxy variables such as store tier or banner classification can be used.
2. Historical Sampling Performance
This is the single most powerful input.
Key variables:
- Samples served per hour
- Engagement rate (meaningful interactions vs. pass-bys)
- Conversion rate to purchase
- Units sold during event window
Even limited historical data can materially improve forecast quality.
Example:
A spirits brand may discover that suburban big-box locations generate higher sample volume but lower conversion than urban specialty retailers. The model should treat those stores differently—even if total traffic is similar.
3. Brand and SKU Factors
Not all products convert at the same rate.
Include:
- Category (RTD, wine, spirits, THC beverage, non-alc alternative)
- Price point
- Pack configuration
- Brand awareness stage in the market
Industry estimate: brands in early market entry often see 30–45% lower sampling conversion rates than established regional brands during the first 90 days of distribution (estimate).
4. Market Maturity
Geography materially influences performance.
Inputs may include:
- Weeks since distribution launch
- Number of active accounts in the market
- Distributor sales coverage level
Sampling in a launch market behaves very differently from sampling in a mature cluster.
5. Execution Variables
Execution quality must be modeled—not assumed.
Variables to capture:
- Brand ambassador experience level
- Event duration
- Daypart and day of week
- Display presence or off-shelf placement
- Retailer support (manager buy-in, visibility, signage)
A Simple Forecast Structure That Actually Works
A practical starting model can be built using the following structure:
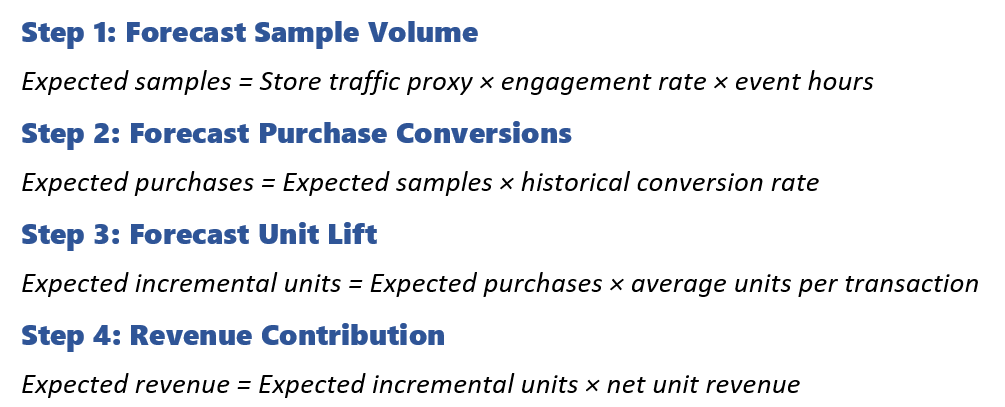
This framework is intentionally simple. Complexity should be added only after data coverage improves.
Moving Beyond Averages: Introducing Store Segmentation
One of the most common mistakes in sampling analytics is over-aggregation.
Instead of a single national conversion rate, segment stores into performance clusters:
- High-traffic / low-conversion
- Moderate-traffic / high-conversion
- Specialty / destination accounts
- Launch-market accounts
Each cluster should maintain its own forecast coefficients.
This approach allows sales leaders to answer a more meaningful question:
“Which stores deserve sampling investment?”
—not merely—
“Which stores can host a sampling event?”
Real-World Example: Regional RTD Launch
A regional RTD brand launching across two metro markets used a segmented store-level forecast model.
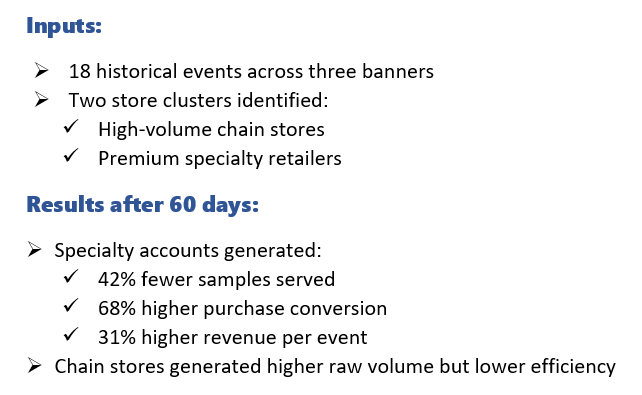
The model shifted future sampling investment toward specialty stores for early-stage brand building, while reserving chain sampling for promotional windows only.
This decision was driven entirely by store-level forecast outputs—not anecdotal feedback.
Why Distributors Care About Your Forecast Model
A credible forecast model strengthens supplier–distributor alignment in three critical ways:
- It supports realistic volume expectations tied to activation
- It allows distributor teams to prioritize accounts with higher probability of return
- It enables post-event accountability discussions grounded in data
When suppliers can show:
- expected lift,
- forecast accuracy,
- and learning cycles,
sampling moves from “marketing activity” into the commercial planning process.
Data Infrastructure Considerations

Forecasting fails without consistent data capture.
At a minimum, sampling programs should capture:
- Store ID and banner
- Event timing and duration
- Samples served
- Units sold during event window
- Display and placement indicators
This is where technology-enabled activation platforms become essential.
At Liquid to Lips, sampling data is structured at the store and event level—allowing forecasting models to be continuously retrained as more activations occur. This enables teams to move beyond static recaps and into live learning systems that improve event allocation over time.
Common Pitfalls to Avoid

- Treating all stores as interchangeable
- Using national averages to plan local activations
- Ignoring execution quality as a forecasting variable
- Failing to track post-event velocity
- Over-engineering models before data maturity exists
Forecasting maturity should evolve in parallel with data maturity.
Actionable Takeaways for Beverage Leaders
To begin building a store-level sampling forecast model:
- Standardize event data collection across all markets
- Define at least three store performance clusters
- Separate forecast logic for launch vs. mature markets
- Track execution variables, not just sales outcomes
- Establish a rolling model update cadence (monthly or quarterly)
Most importantly, treat every sampling event as a data asset—not just a marketing expense.
Why a Data-First Activation Partner Matters
Sampling forecasting is not only an analytics exercise—it is an operational discipline.
Execution partners must be able to:
- capture structured event data consistently,
- normalize store identifiers nationally,
- support multi-market reporting,
- and integrate learning into future activation planning.
Liquid to Lips operates as a technology-enabled, data-first sampling platform with national execution capabilities—allowing beverage brands to align field activation with predictive planning rather than post-event guesswork.
This approach does not replace sales strategy. It strengthens it.
Conclusion

Store-level sampling forecast models are rapidly becoming essential for brands seeking scalable, accountable activation programs. By combining store attributes, historical performance, execution quality, and market maturity, beverage leaders can forecast expected outcomes with enough confidence to guide investment decisions.
In an environment where trial remains critical—but budgets are increasingly scrutinized—data-driven activations are no longer optional. They are foundational to sustainable growth.