
Table setup engagement is one of the most overlooked performance drivers in retail beverage sampling. For brand leaders responsible for trial, conversion, and retail partner relationships, the physical demo table is not a visual detail—it is operational infrastructure that directly affects shopper approach rates, interaction quality, and activation ROI.
This article outlines a practical, data-driven framework for building sampling tables that perform consistently across stores, banners, and markets.
Executive Summary
Optimizing table setup for maximum engagement directly improves shopper flow, compliance execution, and Brand Ambassador effectiveness. Small layout decisions—table orientation, product hierarchy, and ambassador positioning—can materially lift interaction volume without increasing staffing or media spend. This guide provides a scalable, data-informed model designed for beverage brand managers, distributor partners, and national activation teams. Sustained table setup engagement is what separates scalable national programs from isolated high-performing demos.
Why Table Setup Is a Performance Variable (Not a Brand Aesthetic Choice)

In beverage sampling, your table is the first operational touchpoint between the brand and the shopper. It determines:
- Whether shoppers notice the activation
- Whether they feel comfortable approaching
- Whether the Brand Ambassador can efficiently qualify and convert
Estimated industry benchmarks (field observation across national retail programs):
- Activations with clear product visibility and unobstructed ambassador access generate 20–35% higher average shopper interactions per hour.
- Poor table positioning and cluttered setups reduce meaningful conversations by 15–25%, even in identical traffic conditions.
The implication is simple: traffic does not equal opportunity. Setup quality determines how much of that traffic converts into brand engagement.
The Behavioral Funnel of a Demo Table
Every successful demo table must support three behavioral stages:
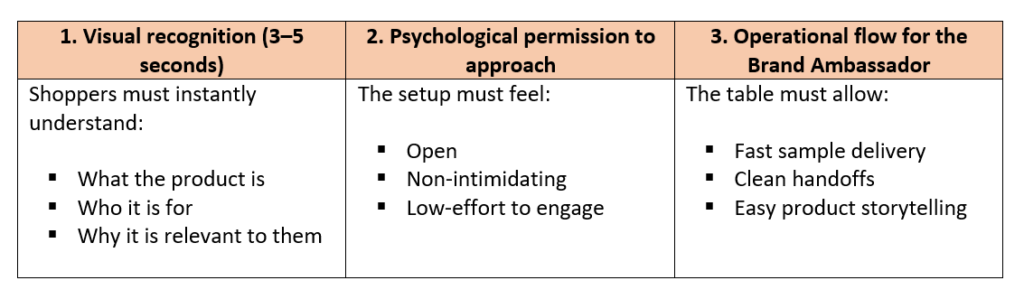
If any of these three fail, engagement drops—even with a strong ambassador.
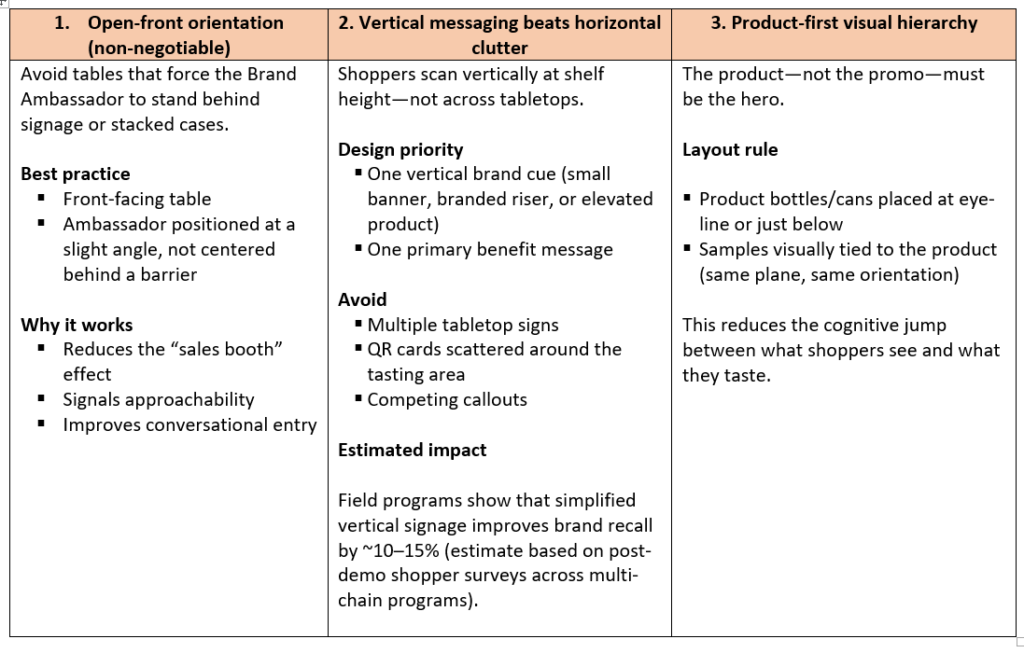
The High-Impact Demo Table Layout Framework
Optimizing Table Depth and Physical Footprint
Large tables do not equal better engagement.
The optimal footprint supports:
- A clean sample zone
- A visible product zone
- A discreet storage zone
Recommended operational zones
- Front 40% – Engagement zone
- Samples
- Small tasting mat
- Brand story cue
- Middle 40% – Product display
- Primary SKUs only
- Rear 20% – Operational buffer
- Backup cups
- Wipes
- Sanitizer
Overfilling the table with cases or secondary SKUs consistently slows interaction speed and creates visual noise.
The Compliance Layer: Designing for Regulated Retail
In spirits, beer, wine, and THC beverage activations, compliance must be embedded into the table design—not managed verbally.
Setup elements that support compliance
- Clearly separated sample area
- Ambassador-controlled sample handoff
- No self-serve access
- ID check tools placed outside of the main tasting surface
Well-designed tables reduce:
- Ambassador hesitation
- Bottlenecking during ID checks
- Store manager concerns about visibility and control
This matters operationally. Retail partners often judge future placement opportunities based on how professionally controlled the demo appears.
Positioning the Ambassador for Maximum Conversion
Your table layout should support how Brand Ambassadors actually work.
High-performing positioning pattern
- Ambassador stands slightly off-center
- One shoulder open toward traffic
- Hands unobstructed
This enables:
- Natural greeting posture
- Easy eye contact
- Faster transitions between conversations
Estimated conversion impact
Programs that standardize ambassador positioning within the table footprint see ~10–20% higher qualified interactions per hour versus “free-form” setups.
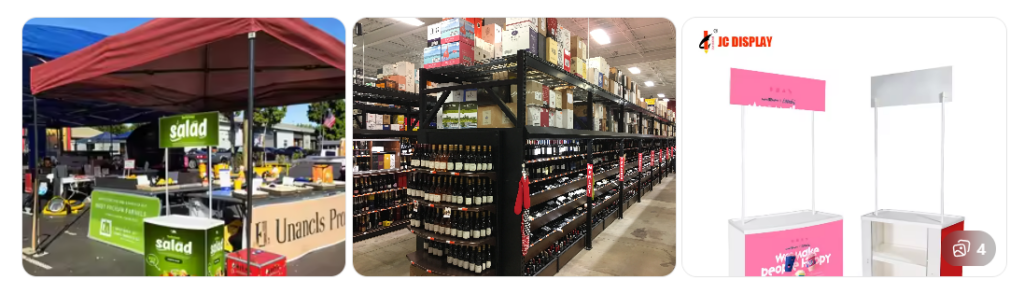
Real-World Example: Small Format, Big Result
A national ready-to-drink cocktail brand executed a 12-city retail sampling program using a compact 4-foot table footprint.
After the first two weeks, field data showed:
- High traffic but low engagement per hour
The only operational change made:
- Removed secondary signage
- Elevated one hero SKU
- Repositioned ambassador to open-front orientation
Result (estimated based on program reporting)
- +22% increase in shopper approaches per hour
- +18% increase in completed tastings per shift
No changes were made to script, staffing, or schedule.
Using Data to Continuously Optimize Setup
Leading activation programs no longer rely on static planograms.
High-performing teams track:
- Engagements per hour
- Samples poured per hour
- Dwell time per interaction
- Conversion proxies (email capture, coupon redemption, follow-on purchase signals where available)
A technology-enabled activation partner can link table configuration, location, and ambassador execution quality to real engagement performance.
This is where data-first sampling platforms create operational advantage—because setup optimization becomes repeatable, not anecdotal.
Table Setup Checklist for Field Teams
Use this before every activation:
- Open-front layout with no physical barrier between ambassador and shopper
- One vertical brand message only
- Hero SKU elevated and clearly visible
- Sample area visually connected to product
- Clean operational buffer zone
- Compliance tools accessible but not visually dominant
- Ambassador positioned at a conversational angle
Why This Matters for National Programs
When brands scale from regional pilots to national programs, table inconsistency becomes a hidden performance risk.
Without standardized, data-backed setup models:
- Engagement metrics fluctuate by market
- Store managers experience uneven professionalism
- Performance insights become difficult to compare
This is why technology-enabled activation partners and national execution platforms increasingly standardize table configuration as part of their operating model—alongside staffing, training, and reporting.
At Liquid to Lips Marketing, table setup is treated as an execution variable that can be measured, tested, and optimized—not as a creative afterthought. This data-first approach allows beverage brands to deploy nationally while still improving performance at the store level.
Actionable Takeaways for Beverage Leaders
- Treat demo tables as performance infrastructure, not display furniture.
- Standardize one open-front layout model before scaling nationally.
- Reduce signage and prioritize vertical brand cues.
- Design compliance into the physical setup, not the script.
- Track engagement metrics by table configuration to identify what actually converts.
Conclusion: Data-Driven Activations Start at the Table
Optimizing table setup is one of the lowest-cost, highest-impact improvements available in beverage sampling today. In a crowded retail environment, the physical experience determines whether your brand earns attention—or blends into background noise.
Data-driven activations begin where the shopper stands. By pairing disciplined table design with national execution and technology-enabled performance tracking, brands can transform sampling from a tactical expense into a scalable growth channel.