
Executive Summary
A well-designed sampling dashboard transforms beverage activations from anecdotal efforts into measurable performance drivers. By centralizing data on engagement, conversion, and execution, brand teams gain real-time visibility into what’s working—and where to optimize. For supplier leaders and distributors, dashboards provide the proof needed to support expansion and prioritization. In an increasingly competitive market, a data-driven sampling dashboard is not optional—it’s foundational to sustained brand velocity.
Why Sampling Dashboards Matter
Sampling remains one of the most effective ways to drive trial in beverage alcohol and emerging categories like THC drinks. However, without structured measurement, even high-quality activations can lack accountability.
A sampling dashboard solves this by:
- Consolidating activation data across markets
- Standardizing performance metrics
- Enabling real-time visibility
- Supporting faster, evidence-based decisions
Industry estimate:
Brands that implement structured activation reporting see 20–30% improvement in resource allocation efficiency, driven by better targeting and reduced wasted spend.
From Field Activity to Business Intelligence
Traditionally, sampling data has been fragmented—captured in spreadsheets, anecdotal reports, or not at all. A dashboard converts that fragmented input into actionable intelligence.
What a Sampling Dashboard Should Do
At its core, a sampling dashboard should:
- Track execution across all activations
- Measure engagement and conversion
- Identify high- and low-performing markets
- Provide insights that inform future strategy
This shifts sampling from a tactical activity to a strategic growth lever.
Core Metrics Every Sampling Dashboard Should Include
The value of a dashboard depends on the quality and relevance of its metrics. Beverage leaders should prioritize metrics that directly connect sampling to business outcomes.
1. Execution Metrics
These ensure activations are happening as planned.
- Number of activations completed
- Samples distributed
- On-time and in-full execution rates
- Account coverage by market
2. Engagement Metrics
These measure consumer interaction.
- Number of consumer engagements
- QR code scans or digital interactions
- Engagement rate (engagements vs. samples)
3. Conversion Metrics
These connect trial to purchase behavior.
- Immediate purchase rate (where trackable)
- Coupon or rebate redemptions
- Post-activation sales lift (where data is available)
Industry estimate:
Sampling programs with integrated digital tracking can measure conversion with 30–50% greater accuracy than traditional methods.
4. Cost Efficiency Metrics
Understanding cost per outcome is critical.
- Cost per sample
- Cost per engagement
- Cost per conversion
These metrics allow brands to compare performance across markets and optimize spend.
5. Market and Account Performance
Dashboards should highlight:
- Top-performing accounts
- High-conversion markets
- Underperforming locations
This enables teams to scale what works and address gaps quickly.
Designing a Dashboard That Drives Decisions
Not all dashboards are effective. The most valuable dashboards are designed with decision-making in mind, not just reporting.
Key Design Principles
1. Simplicity and Clarity
Avoid overloading users with data. Focus on the metrics that matter most.
2. Real-Time or Near Real-Time Updates
Timely data allows for in-flight optimization rather than post-mortem analysis.
3. Role-Based Views
Different stakeholders need different insights:
- Brand managers: campaign performance and ROI
- Sales leaders: account-level performance
- Distributors: depletion support and velocity indicators
4. Visual Prioritization
Use clear charts and summaries to highlight trends, not just raw numbers.
Integrating Data Sources
A sampling dashboard is only as strong as the data feeding it. Integration is critical.
Common Data Inputs
- Field reports from brand ambassadors
- QR code and digital engagement platforms
- Retail sales data (where available)
- Distributor depletion data
- Event and activation schedules
The Challenge
Many brands struggle with disconnected systems, leading to incomplete insights.
The Opportunity
A centralized, technology-enabled platform can unify these inputs—creating a single source of truth for activation performance.
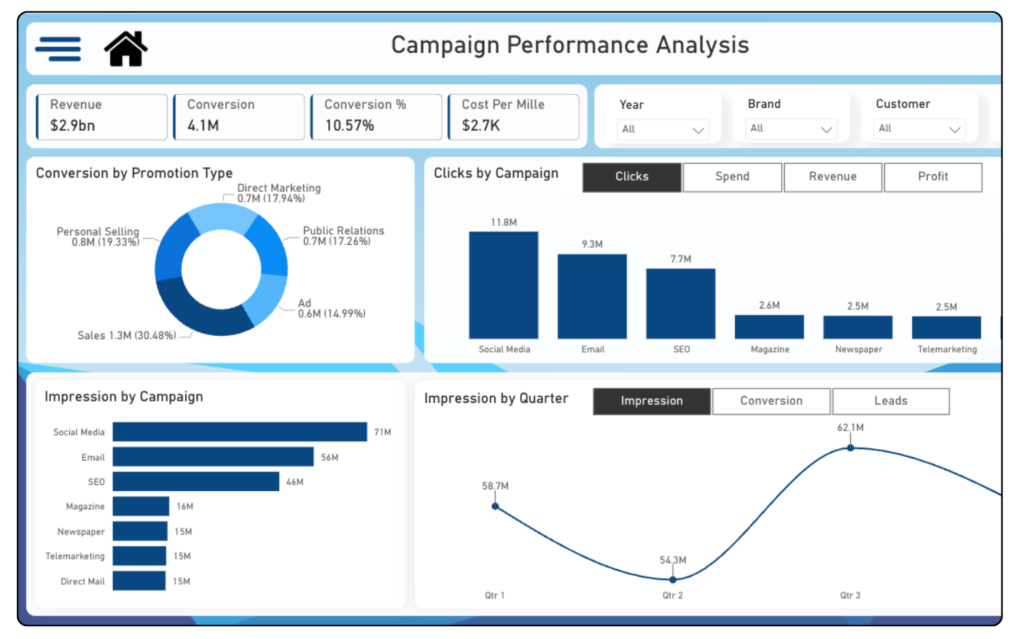
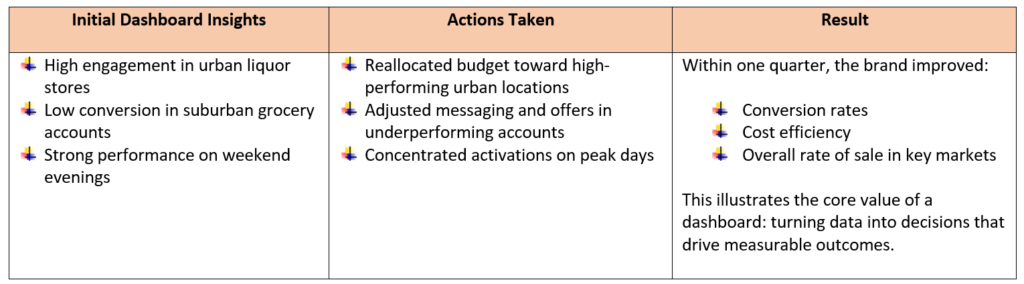
Real-World Application: Turning Insights into Action
Consider a mid-sized RTD brand running activations across three states.
Common Pitfalls to Avoid
Even with the right intent, dashboards can fall short if not executed properly.
1. Tracking Too Many Metrics
More data is not always better. Focus on metrics tied to business impact.
2. Delayed Reporting
Data that arrives weeks later limits its usefulness.
3. Lack of Standardization
Inconsistent data collection leads to unreliable insights.
4. No Clear Ownership
Without accountability, dashboards become underutilized.
The Role of Technology and Execution
Building and maintaining a sampling dashboard requires both infrastructure and disciplined execution.
Brands benefit from partners that can:
- Capture consistent, high-quality field data
- Integrate digital engagement tools (e.g., QR codes)
- Provide real-time reporting capabilities
- Execute activations reliably across markets
A technology-enabled activation partner with a data-first sampling platform can ensure that dashboards are not just built—but continuously fed with accurate, actionable data. Combined with national execution capabilities, this creates a scalable system for performance-driven activations.
Actionable Takeaways for Beverage Leaders
To build an effective sampling dashboard:
- Define your objectives: Align metrics with business goals (e.g., velocity, conversion)
- Standardize data collection: Ensure consistency across all activations
- Prioritize key metrics: Focus on execution, engagement, conversion, and cost
- Enable real-time visibility: Use platforms that provide timely updates
- Integrate systems: Combine field, digital, and sales data
- Act on insights: Use dashboard data to continuously optimize strategy
Conclusion: From Reporting to Performance
A sampling dashboard is more than a reporting tool—it is a decision engine that drives smarter activations and stronger results. By connecting execution to measurable outcomes, dashboards enable beverage brands to optimize spend, improve conversion, and build sustained brand velocity.
In a market where every activation must justify its impact, data-driven dashboards are essential to turning sampling into a scalable, performance-driven growth strategy.